Friday, September 16, 2011

David Banister: Gold Heading to $2,350 Per Ounce After 4th Wave Consolidation


In my most recent few forecasts for subscribers and public articles I’ve discussed a major correction in Gold, and it dropped $208 within 3 days of that forecast several weeks ago as Gold traders will recall. Last week I wrote about further consolidation being required in what I’m seeing as a either 4th wave likely “Triangle Pattern” that will consolidate the 34 month run from $681 to $1910 into August of this year, or a 3 wave “A B C” pattern. We are right now in some form of C wave, it’s just a matter now of confirming if we are going to get a “D and E” wave to follow, or the C wave drops lower before we bottom.

A Triangle pattern serves to let the “economics of the security” catch up with the prior large movement upwards in price. In essence, the crowd behavior pushed the price of Gold a bit too high too fast, and this consolidation pattern lets the fundamentals catch up to price action. We had a parabolic move I discussed many weeks ago, and those always end badly to the downside. The $208 drop in three days is a typical reaction to a spike run like that. At the end of the day though, I had been forecasting what I call a “Wave 3” top and was looking for a multi week or multi month consolidation pattern before Gold could move higher.

Let’s examine what that triangle projection may look like.

They take the form of 5 waves, or what we can call ABCDE in a pattern. The biggest drop is always the “A” wave, and that was 1910 to 1702 in 3 days or less. The next biggest drop is the “C” Wave, and that was 1920 to 1793, noting it was a Fibonacci 61.8% drop relative to the A wave. In other words, each successive wave down in the 5 wave triangle is smaller. This is due to the sentiment finally shifting and the trading patterns moving from people chasing the hot sector or stock or metal, to the long term investors accumulating the dips.

If we end up consolidating in a “Triangle”, then Gold should end up looking something like the below pattern I drew, with a target of $2,350 per ounce many months out:


The other pattern we are watching for at TMTF is the ABC Correction pattern. We had the A wave down to 1702, which corrected 50% of the move from 1480-1910 in 3 days. Rarely do you get a major move down like that and not get some type of “re-test” of that low, but because the fundamentals for Gold are strong and getting stronger, we are favoring the Triangle pattern still as most likely. With that said, there is a fat and juicy “Gap” sitting in the chart around 1660 on Gold and dropping down there is what a lot of traders are watching. If that were to fulfill, then we will see an ABC correction ending around $1643, and then Gold will begin another multi month rally to new highs:


Source : http://networkedblogs.com/n8YxP

Wednesday, September 07, 2011

Akankah perang mata uang bakal terjadi?


ZURICH. Genderang perang mata uang (currency war) sepertinya mulai ditabuh setelah bank sentral Swiss mematok nilai tukar mata uangnya untuk pertama kali sejak 1978. Negara-negara seperti Jepang, Swedia dan Norwegia kini kebakaran jenggot akibat keputusan Swiss National Bank tersebut.

Kemarin (6/9), Swiss National Bank telah menetapkan batas minimum nilai tukar franc terhadap euro sebesar 1,20 franc untuk mempertahankan laju pertumbuhan ekonomi negerinya. Bank sentral Swiss ini juga siap memborong mata uang asing dengan dana tak terbatas untuk mengontrol penguatan franc.

Franc memang telah menguat tajam seiring investor memburunya sebagai safe haven. Nilai tukar franc telah menguat sebesar 8,4% terhadap uero pada pukul 17.15 waktu London menjadi sebesar 1,203 per euro. Penguatan ini merupakan yang terbesar sejak Uni Eropa memberlakukan mata uang tunggal.

Analis menilai, keputusan Swiss National Bank ini akan mendorong investor memburu mata uang lainnya yang lebih menguntungkan. Salah satunya adalah yen. Yen merupakan mata uang save haven kedua setelah franc. "Jadi sangat mungkin yen akan menarik para pembeli untuk menghindari risiko," kata ekonom Meiji Yasuda Life Insurance Yuichi Kodama.

Bila ini terjadi, perekonomian Jepang bakal sedikit lagi ke jurang resesi. Sebab, selama ini penguatan yen telah menggerus nilai ekspor Jepang. Penguatan yen itu membuat ekspor Jepang tidak kompetitif bila dibandingkan China, Korea Selatan dan negara lainnya.

Menteri Keuangan Jepang Jun Azumi telah mengingatkan, keputusan bank sentral Swiss itu akan membahayakan nilai tukar yen. Dia membawa masalah ini dalam pertemuan G-7 pada 9-10 September mendatang di Marseille, Prancis

Karena itu, petinggi Bank of Japan (BOJ) segera menggelar rapat pasca kebijakan Swiss National Bank itu. Selama ini BOJ telah berusaha menahan penguatan yen dengan melakukan intervensi ke pasar. Catatan saja, BOJ telah menggelontorkan dana sebesar US$ 58 miliar untuk menjaga nilai tukar yen. Dana moneter ini merupakan yang terbesar sejak 2004 silam.

Kepala ekonom NLI Research Institute Koichi Haji memperkirakan, BOJ akan bertindak bersama pemerintah Jepang untuk mengintervensi penguatan yen. "Karena selama ini tindakan yang dilakukan BOJ sendirian tidak berefek pada pasar dan ekonomi Jepang," katanya.

Bila Jepang juga mengikuti langkah Swiss, analis memperkirakan, posisi Norwegia dan Swedia bakal menjadi rentan. Foreign Exchange Strategist UBS AG Geoffrey Yu mengatakan, investor akan menyerbu mata uang Swedia dan Norwegia sebagai alternatif investasi.

Dia memperkirakan, pemerintah Norwegia dan Swedia tentu tidak akan tinggal diam. Namun, "Seberapa lama ekonomi lokal toleransi terhadap penguatan mata uangnya," tanyanya.

Berdasarkan indeks korelasi Bloomberg, Krone telah menguat 4,5% terhadap sembilan mata uang pasangannya. Pemerintah Norwegia sendiri telah memberi sinyal akan membendung penguatan mata uangnya yang bisa menggerus nilai ekspor dan tampaknya perang mata uang ronde kedua bakal terjadi.


Source: http://investasi.kontan.co.id/v2/read/1315374380/76811/Akankah-perang-mata-uang-terjadi

Monday, June 20, 2011

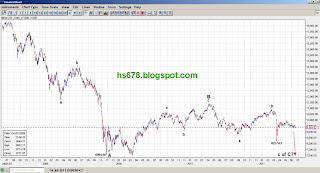
Technical View : Japan's Stock Index Nikkei 225

Index Saham Jepang Nikkei225


Last : 9354.32 (20 Juni 2011-Jakarta Time)


Dengan menggunakan Elliott Wave, secara teknis Index Saham Jepang Nikkei 225 sedang berproses dalam wave c of C. Apabila asumsi tersebut benar, maka Index Saham Jepang Nikkei225 berpeluang menguji kembali level 8227.63 (14 Maret 2011) yang merupakan level terendah pada saat tsunami Jepang pada bulan Maret tahun ini. Dan juga berpeluang menguji kembali 6994.90 (27 October 2008) yang merupakan level wave A yang juga merupakan level terendah pada saat krisis keuangan tahun 2008 (Lihat chart di bawah).


Disclaimer :
The information contained in this article is intended for informational purposes only. This information was compiled from sources believed to be reliable but accuracy cannot be and is not guaranteed. There is no warranty, express or implied, in regards to this information for any particular purpose. This information is provided freely and is not in the capacity of a trading advisor. NO liability on the part of the author exists for any trading loss you may incur in the use of this information.

Tuesday, June 14, 2011

What The U.S. Dollar & The Euro Mean To The S&P500

By J.W. Jones

The buzz around the blogosphere and in the media is that Quantitative Easing II is scheduled to end in around 3 weeks. Already pundits are asking about Quantitative Easing III as a matter of when, not if. In reality a QE III Lite version is already in the cards as the Federal Reserve has stated they will be buying Treasuries and Mortgage Backed Securities (MBS) with maturing issues. The Fed also plans on reinvesting the interest earned from the existing portfolio (Roughly $15 billion/monthly).


When it comes to the application of financial principles, doing the opposite of what everyone else does generally leads to an extreme variation in the overall results. While the results are not always better, they are at the very least significantly different from what most lemmings within the group experience. In every aspect of my financial life I try to do the opposite of what the herd is doing. It takes experience and a significant level of discipline, but buying from the herd when they are selling and being willing to sell into a crowd when they are buying is a great way to trade. It sounds easy, but for most people it is not, myself included.

Right now financial markets are uncertain. I would be remiss if I did not point out the recent strength in the U.S. Dollar Index and the potential higher low that it has carved out on the daily and weekly charts. The weekly chart of the U.S. Dollar Index is shown below:


The current pattern on the U.S. Dollar Weekly chart is bullish. We could see the U.S. Dollar Index trade significantly higher from here as it has been under severe selling pressure for an extended period of time. While I believe technical analysis is just one context through which to view financial markets, it is uncanny how often market cycles and headline events line up. Is it merely a coincidence that the U.S. Dollar is potentially bottoming around the same time the Federal Reserve is ending the QE II asset purchase program?

Regardless of what camp economists are in, we presently live in a strange time for financial markets and capitalism in general. One of the more interesting charts to study is the Euro currency, which in contrast to the U.S. Dollar Index appears to have a more bearish pattern. Could it be that the U.S. Dollar is setting up to rally because of the perceived weakness of the Eurozone? The daily chart of the Euro ETF is shown below:


The Dollar may be firming up here based on the Euro's weakness and it may have absolutely nothing to do with QE II ending. I always refer to price action and never question Mr. Market's directional bias. If the U.S. Dollar begins to work higher what impact will it have on equities?
A stronger U.S. Dollar would certainly put pressure on risk assets, specifically equity and commodity prices. As it turns out, we are at an interesting juncture in financial markets at this point in time.

The 4 year stock market cycle is nearing an end, a presidential election will take place in less than 18 months, the U.S. government has a massive debt crisis developing, and the European debt crisis continues to mature in what will likely be a microcosm of what we will face here in the United States. The Middle East remains tense at the very least and the recent OPEC announcement to maintain supply levels has helped support oil prices.

Higher oil prices have obviously slowed down the U.S. economy as the consumer is strapped with higher costs on nearly everything, specifically food and energy. In addition, the unemployment numbers are seemingly not improving and housing appears to be rolling over . . . again.

Almost everywhere we look the news is bleak. Mr. Market has shrugged off bad news time and time again since the March 2009 lows. The long term shorts remain frustrated to say the least and those who were actively shorting along the way have likely been stopped out multiple times. Everywhere I look market commentary is bearish and pundits are talking about additional weakness as they point to a rallying Dollar and multiple economic headwinds facing domestic markets.

Traders and investors should be focused on a few specific price levels on the S&P500. With the Dollar rallying, the S&P 500 index has remained under extreme selling pressure for multiple weeks. The S&P500 (SPX) is likely going to test its 200 period moving average. From there I am expecting a bounce higher, although the bounce may be nothing more than a Dead Cat Bounce.

As always, time and price will be the final arbiter but if the Dollar continues to trade higher we could see the S&P500 lose its 200 period moving average and eventually test a major support level which needs to hold up for the bulls. If the March 16, 2011 pivot lows are taken out to the downside, the next leg of the secular bear market may be under way. The daily chart of the SPX illustrated below shows the key price levels and the potential price action that may lead up to a key test of the March 2011 pivot lows:


Very rarely does the first mouse get the cheese, so I would anticipate a bounce off of the 200 period moving average which currently coincides with the March pivot lows. With not only the pivot lows but the 200 period moving average offering support a breakdown lower will be a large tell about the health and future price action of the S&P500.


Right now I am just going to focus on how the S&P500 handles the key support zone illustrated above. The forthcoming price action will tell traders everything we need to know about the health of financial markets. I have no idea if we are about to enter a double dip recession nor do I know whether price action will even test the March pivot lows.

What I do know is that price action in coming days around key support areas is going to be critical. I am convinced that Mr. Market will tell us whether the bullish party will continue or come to an end in the next few weeks/months. A breakdown of the March pivot lows in the future will likely initiate the launch sequence for the next secular bear market. I would keep the S&P500 1,250 price level on the radar going forward. Risk remains high.
JW Jones

Source :
http://www.gold-eagle.com/editorials_08/jones061211.html

Monday, June 13, 2011

Negative Momentum In Gold And Silver To Continue?


Let's begin today's discussion with fresh Fed decisions and its implications on capital markets. Ben Bernanke sent a strong signal recently that despite weaker economic data, the US Federal Reserve is not planning to loosen monetary policy. He said that the recovery "appears to be proceeding at a moderate pace", in other words, no QE3, at least not for now. Wall Street turned south, the 10-year Treasury yield eased back under 3 per cent and gold futures fell. In the last Premium Update before we knew what Bernanke planned to say, we said that it was a good idea to close long speculative positions in gold. 


Mark your calendars. On June 30th the Fed will end its second round of quantitative easing, the money supply will tighten. It is the flood of money pumped out by the Fed that has propped up the stock market for the past three years. What will happen when the dollar pump shuts off? It seems plain common sense that the stock markets will go down. It also makes sense that when markets will plummet to where it really hurts; the politicians will demand a new round of QE. We find it difficult, if not impossible to believe that there will not be QE3 in the future.

It's only a matter of time before the Fed will have to turn on the presses again sending a message to America's creditors that they will be repaid in devalued fiat currency. All around the world, more and more central banks are selling dollars and buying gold. Apparently they have come to the conclusion that U.S. credit is not that reliable and that the value of the dollar is likely to decline. We have come to that conclusion long ago and have been recommending long-term positions in precious metals.

In desperate times it's good to hold some physical gold and silver. The investment demand is clearly strong from individual (small) buyers, but does it mean that markets will move up soon?
Let's move to chart analysis to find out more about the short-term trends. We will begin this technical part with the analysis of the Euro Index. We will start with the long-term chart (charts courtesy by http://stockcharts.com.)


We begin with the long-term Euro Index chart where we have seen a continuation of the trend to higher index levels. However, based on the price action seen this week, there may be a slight pause underway which perhaps will be followed by a retest of the declining support line. A move below this level could be followed by additional declines to yet another support level.
The implications for gold, silver and gold and silver mining stocks are the same as was seen in previous declines of the Euro Index where the precious metals sector generally declined as well. It is important at this time for all precious metals Investors to keep an eye on the decline of the euro for these reasons.

Additional implication is that currently the analysis of the short-term chart (below) is just no less important than the analysis of the long-term one (above).


In the short-term Euro Index chart, we can clearly see the important short-term cycles which generally have had profound impacts not only upon currencies but also upon gold. The chart suggests that the local top was in a few days ago and this will likely lead to lower Euro Index levels and lower gold prices in the days ahead. Note that these short-term cyclical tendencies have been particularly reliable on a short-term basis, but if we are, in fact, on the verge of a bigger downward move, this could very well be the trigger for it.


Moving on to the long-term USD Index chart, we see that index levels recently moved below the 2009 lows and then reversed direction. It is possible that we could see a local bottom as there is a support line here created by the 2009 November low.

Fundamentally speaking, the situation favors a short-term rally. The markets are digesting news that we won't see QE3 soon and that the supply of the USD will be at least somewhat limited. On the other hand problems within the EU make many market participants believe that EU will monetize its debt either directly or indirectly (without calling it such). Combining these two points provides us with a short- / medium-term bullish picture for the USD Index (recall that the EUR:USD exchange rate is the most important part of the USD Index).


In the short-term USD Index chart, we see the cyclical turning points, which are represented by the vertical lines in our chart. It's important to note here that these have medium-term magnitude with respect to index level trends. Presently, the USD Index is close to a local bottom and this is consistent with points made earlier.

The USD Index is therefore likely to move higher from here. It is unclear at this time whether the level of previous highs will be reached and/or surpassed (based on the strong support in Euro). Whatever the situation, generally speaking, higher USD Index values will likely have a negative impact upon gold, silver and gold and silver mining stocks and the signals from this chart also support this short-term outlook.

Summing up, the USD Index has become bullish at least for the short term and the Euro Index conversely appears to be in an analogous period of decline. These changes reflect the fundamental news of no QE3 that some market participants were counting on. Consequently, the short-term picture for gold, silver and mining stocks is now bearish.
Thank you for reading. Have a great and profitable week!

P. Radomski
Editor
Sunshine Profits

Source :
http://www.gold-eagle.com/editorials_08/radomski061011.html

Share

Twitter Delicious Facebook Digg Stumbleupon Favorites