Monday, June 20, 2011

Technical View : Japan's Stock Index Nikkei 225

Index Saham Jepang Nikkei225


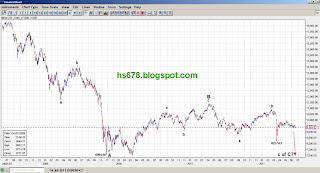
Last : 9354.32 (20 Juni 2011-Jakarta Time)


Dengan menggunakan Elliott Wave, secara teknis Index Saham Jepang Nikkei 225 sedang berproses dalam wave c of C. Apabila asumsi tersebut benar, maka Index Saham Jepang Nikkei225 berpeluang menguji kembali level 8227.63 (14 Maret 2011) yang merupakan level terendah pada saat tsunami Jepang pada bulan Maret tahun ini. Dan juga berpeluang menguji kembali 6994.90 (27 October 2008) yang merupakan level wave A yang juga merupakan level terendah pada saat krisis keuangan tahun 2008 (Lihat chart di bawah).


Disclaimer :
The information contained in this article is intended for informational purposes only. This information was compiled from sources believed to be reliable but accuracy cannot be and is not guaranteed. There is no warranty, express or implied, in regards to this information for any particular purpose. This information is provided freely and is not in the capacity of a trading advisor. NO liability on the part of the author exists for any trading loss you may incur in the use of this information.

Tuesday, June 14, 2011

What The U.S. Dollar & The Euro Mean To The S&P500

By J.W. Jones

The buzz around the blogosphere and in the media is that Quantitative Easing II is scheduled to end in around 3 weeks. Already pundits are asking about Quantitative Easing III as a matter of when, not if. In reality a QE III Lite version is already in the cards as the Federal Reserve has stated they will be buying Treasuries and Mortgage Backed Securities (MBS) with maturing issues. The Fed also plans on reinvesting the interest earned from the existing portfolio (Roughly $15 billion/monthly).


When it comes to the application of financial principles, doing the opposite of what everyone else does generally leads to an extreme variation in the overall results. While the results are not always better, they are at the very least significantly different from what most lemmings within the group experience. In every aspect of my financial life I try to do the opposite of what the herd is doing. It takes experience and a significant level of discipline, but buying from the herd when they are selling and being willing to sell into a crowd when they are buying is a great way to trade. It sounds easy, but for most people it is not, myself included.

Right now financial markets are uncertain. I would be remiss if I did not point out the recent strength in the U.S. Dollar Index and the potential higher low that it has carved out on the daily and weekly charts. The weekly chart of the U.S. Dollar Index is shown below:


The current pattern on the U.S. Dollar Weekly chart is bullish. We could see the U.S. Dollar Index trade significantly higher from here as it has been under severe selling pressure for an extended period of time. While I believe technical analysis is just one context through which to view financial markets, it is uncanny how often market cycles and headline events line up. Is it merely a coincidence that the U.S. Dollar is potentially bottoming around the same time the Federal Reserve is ending the QE II asset purchase program?

Regardless of what camp economists are in, we presently live in a strange time for financial markets and capitalism in general. One of the more interesting charts to study is the Euro currency, which in contrast to the U.S. Dollar Index appears to have a more bearish pattern. Could it be that the U.S. Dollar is setting up to rally because of the perceived weakness of the Eurozone? The daily chart of the Euro ETF is shown below:


The Dollar may be firming up here based on the Euro's weakness and it may have absolutely nothing to do with QE II ending. I always refer to price action and never question Mr. Market's directional bias. If the U.S. Dollar begins to work higher what impact will it have on equities?
A stronger U.S. Dollar would certainly put pressure on risk assets, specifically equity and commodity prices. As it turns out, we are at an interesting juncture in financial markets at this point in time.

The 4 year stock market cycle is nearing an end, a presidential election will take place in less than 18 months, the U.S. government has a massive debt crisis developing, and the European debt crisis continues to mature in what will likely be a microcosm of what we will face here in the United States. The Middle East remains tense at the very least and the recent OPEC announcement to maintain supply levels has helped support oil prices.

Higher oil prices have obviously slowed down the U.S. economy as the consumer is strapped with higher costs on nearly everything, specifically food and energy. In addition, the unemployment numbers are seemingly not improving and housing appears to be rolling over . . . again.

Almost everywhere we look the news is bleak. Mr. Market has shrugged off bad news time and time again since the March 2009 lows. The long term shorts remain frustrated to say the least and those who were actively shorting along the way have likely been stopped out multiple times. Everywhere I look market commentary is bearish and pundits are talking about additional weakness as they point to a rallying Dollar and multiple economic headwinds facing domestic markets.

Traders and investors should be focused on a few specific price levels on the S&P500. With the Dollar rallying, the S&P 500 index has remained under extreme selling pressure for multiple weeks. The S&P500 (SPX) is likely going to test its 200 period moving average. From there I am expecting a bounce higher, although the bounce may be nothing more than a Dead Cat Bounce.

As always, time and price will be the final arbiter but if the Dollar continues to trade higher we could see the S&P500 lose its 200 period moving average and eventually test a major support level which needs to hold up for the bulls. If the March 16, 2011 pivot lows are taken out to the downside, the next leg of the secular bear market may be under way. The daily chart of the SPX illustrated below shows the key price levels and the potential price action that may lead up to a key test of the March 2011 pivot lows:


Very rarely does the first mouse get the cheese, so I would anticipate a bounce off of the 200 period moving average which currently coincides with the March pivot lows. With not only the pivot lows but the 200 period moving average offering support a breakdown lower will be a large tell about the health and future price action of the S&P500.


Right now I am just going to focus on how the S&P500 handles the key support zone illustrated above. The forthcoming price action will tell traders everything we need to know about the health of financial markets. I have no idea if we are about to enter a double dip recession nor do I know whether price action will even test the March pivot lows.

What I do know is that price action in coming days around key support areas is going to be critical. I am convinced that Mr. Market will tell us whether the bullish party will continue or come to an end in the next few weeks/months. A breakdown of the March pivot lows in the future will likely initiate the launch sequence for the next secular bear market. I would keep the S&P500 1,250 price level on the radar going forward. Risk remains high.
JW Jones

Source :
http://www.gold-eagle.com/editorials_08/jones061211.html

Monday, June 13, 2011

Negative Momentum In Gold And Silver To Continue?


Let's begin today's discussion with fresh Fed decisions and its implications on capital markets. Ben Bernanke sent a strong signal recently that despite weaker economic data, the US Federal Reserve is not planning to loosen monetary policy. He said that the recovery "appears to be proceeding at a moderate pace", in other words, no QE3, at least not for now. Wall Street turned south, the 10-year Treasury yield eased back under 3 per cent and gold futures fell. In the last Premium Update before we knew what Bernanke planned to say, we said that it was a good idea to close long speculative positions in gold. 


Mark your calendars. On June 30th the Fed will end its second round of quantitative easing, the money supply will tighten. It is the flood of money pumped out by the Fed that has propped up the stock market for the past three years. What will happen when the dollar pump shuts off? It seems plain common sense that the stock markets will go down. It also makes sense that when markets will plummet to where it really hurts; the politicians will demand a new round of QE. We find it difficult, if not impossible to believe that there will not be QE3 in the future.

It's only a matter of time before the Fed will have to turn on the presses again sending a message to America's creditors that they will be repaid in devalued fiat currency. All around the world, more and more central banks are selling dollars and buying gold. Apparently they have come to the conclusion that U.S. credit is not that reliable and that the value of the dollar is likely to decline. We have come to that conclusion long ago and have been recommending long-term positions in precious metals.

In desperate times it's good to hold some physical gold and silver. The investment demand is clearly strong from individual (small) buyers, but does it mean that markets will move up soon?
Let's move to chart analysis to find out more about the short-term trends. We will begin this technical part with the analysis of the Euro Index. We will start with the long-term chart (charts courtesy by http://stockcharts.com.)


We begin with the long-term Euro Index chart where we have seen a continuation of the trend to higher index levels. However, based on the price action seen this week, there may be a slight pause underway which perhaps will be followed by a retest of the declining support line. A move below this level could be followed by additional declines to yet another support level.
The implications for gold, silver and gold and silver mining stocks are the same as was seen in previous declines of the Euro Index where the precious metals sector generally declined as well. It is important at this time for all precious metals Investors to keep an eye on the decline of the euro for these reasons.

Additional implication is that currently the analysis of the short-term chart (below) is just no less important than the analysis of the long-term one (above).


In the short-term Euro Index chart, we can clearly see the important short-term cycles which generally have had profound impacts not only upon currencies but also upon gold. The chart suggests that the local top was in a few days ago and this will likely lead to lower Euro Index levels and lower gold prices in the days ahead. Note that these short-term cyclical tendencies have been particularly reliable on a short-term basis, but if we are, in fact, on the verge of a bigger downward move, this could very well be the trigger for it.


Moving on to the long-term USD Index chart, we see that index levels recently moved below the 2009 lows and then reversed direction. It is possible that we could see a local bottom as there is a support line here created by the 2009 November low.

Fundamentally speaking, the situation favors a short-term rally. The markets are digesting news that we won't see QE3 soon and that the supply of the USD will be at least somewhat limited. On the other hand problems within the EU make many market participants believe that EU will monetize its debt either directly or indirectly (without calling it such). Combining these two points provides us with a short- / medium-term bullish picture for the USD Index (recall that the EUR:USD exchange rate is the most important part of the USD Index).


In the short-term USD Index chart, we see the cyclical turning points, which are represented by the vertical lines in our chart. It's important to note here that these have medium-term magnitude with respect to index level trends. Presently, the USD Index is close to a local bottom and this is consistent with points made earlier.

The USD Index is therefore likely to move higher from here. It is unclear at this time whether the level of previous highs will be reached and/or surpassed (based on the strong support in Euro). Whatever the situation, generally speaking, higher USD Index values will likely have a negative impact upon gold, silver and gold and silver mining stocks and the signals from this chart also support this short-term outlook.

Summing up, the USD Index has become bullish at least for the short term and the Euro Index conversely appears to be in an analogous period of decline. These changes reflect the fundamental news of no QE3 that some market participants were counting on. Consequently, the short-term picture for gold, silver and mining stocks is now bearish.
Thank you for reading. Have a great and profitable week!

P. Radomski
Editor
Sunshine Profits

Source :
http://www.gold-eagle.com/editorials_08/radomski061011.html

Jenson Button wins stunning Canadian Grand Prix

By Andrew Benson
BBC Sport in Montreal
Jenson Button took a stunning victory in a dramatic, rain-affected Canadian Grand Prix by passing Sebastian Vettel on the last lap of an absorbing race.

Vettel's Red Bull ran wide under pressure to gift the win to Button, who recovered after a collision with McLaren team-mate Lewis Hamilton.

Red Bull's Mark Webber was third to deprive Mercedes driver Michael Schumacher of a podium place.Vettel now leads the championship by 60 points from Button.

An incident-packed race saw the safety car used five times and included a two-hour stoppage for heavy rain. Button himself made five pit stops on his way to victory as well as an enforced visit to the pits for a drive-through penalty for speeding under the safety car.

Button described the win as possibly the best of his career.

"I really don't know what to say, it's been a very emotional race," he said. "The incident with Lewis - I couldn't see anything and I've apologised to him.


"It was really a fight from then on but I kept on pushing and I managed to get past Seb at the end. Another great win for me and possibly my best."

McLaren team principal Martin Whitmarsh said: "What a race. He is driving fantastically and we know he deserves it and hope everyone else does, too.

"He just attacked and attacked and delivered a fantastic race. We knew he had to put pressure on Sebastian - and Sebastian made a mistake. From Jenson, that's the stuff of champions, that's the stuff of dreams."

Vettel conceded ruefully: "If you have it in your hands and give it away it is not the sweetest feeling."

BBC F1 commentator Martin Brundle said: "At one point, we were wondering if Button would catch the Hispanias before the race restarted under the safety car and now he's won the race!

"That is one of the races of his life and the best grand prix of a spectacular career."

Co-commentator David Coulthard added: "What a fantastic drive from Jenson Button. It looked like it was all lost and he's well aware you count the winners at the chequered flag."

While Button celebrated, Hamilton left the track after an ignominious race that saw him drop from second to fourth in the championship.

Persistent rain through the morning left the track drenched and the race was started under the safety car.

The drama in one of the most sensational races for years began almost as soon as the drivers were released on lap five, and Hamilton was at the centre of it.

First he collided with Webber, who gave him room at the first corner only for the McLaren to slip off the kerb and into the Australian.

Webber spun and Hamilton had to go around the outside of the Red Bull, rejoining behind Button.

Determined to make up ground, Hamilton pressed his team-mate hard. Button made a mistake at the final chicane at the end of lap eight and Hamilton saw his chance.

He dodged out from behind Button to his team-mate's left but Button continued on the racing line, edging towards the pit wall, apparently looking in his mirror.

Hamilton kept coming and became pincered between Button and the pit wall. The two cars collided, spraying debris over the track.

"What is he doing?" screamed Button on his radio. After the race, he said he had not seen Hamilton but that they had spoken in the two-hour stoppage and agreed it was "just one of those things".

Hamilton said: "While I fell back behind Jenson, he made a mistake into the last corner, so I got the run on him.

"I was on the outside, it felt like I was halfway up alongside him - although I haven't seen the video - and whether he saw me or not he kept moving across, and I was in the wall. It was only the tyre that was busted. I put the 'diff lock' on and the team told me to retire."

Hamilton initially believed the car was undamaged but it turned out the driveshaft had been damaged and the team had been correct to tell him to stop.

The decision to start the race under the safety car was made as the drivers had virtually no experience of the Pirelli wet tyres.

When they were released on lap six, Vettel fended off a brief challenge from Alonso and then streaked away into the distance.

Button was the first leading driver to change to intermediate tyres, after he came into the pits following his collision with Hamilton on lap eight, which brought out the safety car while the debris from the McLarens was cleared from the track.

The race was restarted on lap 13, and the Englishman was soon lapping quicker than anyone else, prompting other drivers to follow his lead in changing tyres.

About half the field came in, including Alonso on lap 17. But within two laps the rain returned, heavier than ever. The safety car came out again on lap 20 before the race was suspended on lap 25.

After a stoppage of two hours and five minutes, they resumed, again under the safety car, before being set loose on lap 34.

Almost immediately the drivers started to stream into the pits for intermediate tyres, so much had the track dried while they were following the safety car.

But four laps after the re-start, the safety car was deployed yet again when Button and Ferrari's Fernando Alonso collided on lap 37, leading to the Spaniard's retirement.

Button was last when the race was restarted on lap 40 but he fought his way through the field thanks to choosing the right time to change to intermediate tyres and then dry-weather slick tyres.

By the time a collision between Nick Heidfeld's Renault and Kamui Kobayashi's Sauber brought out the safety car again with 12 laps to go, Button had climbed to fourth place behind Vettel, Schumacher and Webber.

The race restarted two laps later and Vettel immediately built a lead while the three men behind him battled for position.

Webber, who had brought himself back into contention by becoming the first leading driver to stop for slick tyres, slipped back to fourth when he misjudged the final chicane on lap 64.

Button passed Schumacher on the next lap and set about closing the three-second lead to Vettel with five laps remaining.

They entered the last lap less than a second apart and Vettel made his first serious mistake in a race this season, putting a wheel off line on to the wet part of the track at Turn Six and half-spinning, handing the lead to Button.

Vettel said: "Of course I'm disappointed. It was a very difficult race from start to finish. We led every single lap apart from the last one."

Source :
http://news.bbc.co.uk/sport2/hi/motorsport/formula_one/9511066.stm

Thursday, June 09, 2011

Citi Says Hackers Access Bank Card Data


By Maria Aspan and Narayanan Somasundaram
 

NEW YORK/SYDNEY | Thu Jun 9, 2011 3:24am EDT
 

(Reuters) - Citigroup Inc said computer hackers breached the bank's network and accessed the data of about 200,000 bank card holders in North America, the latest of a string of cyber attacks on high-profile companies.
 

Citi said the names of customers, account numbers and contact information, including email addresses, were viewed in the breach, which the Financial Times said was discovered by the bank in early May.
 

However, Citi said other information such as birth dates, social security numbers, card expiration dates and card security codes (CVV) were not compromised.
 

"We are contacting customers whose information was impacted. Citi has implemented enhanced procedures to prevent a recurrence of this type of event," Sean Kevelighan, a U.S.-based spokesman, said by email.
 

"For the security of these customers, we are not disclosing further details."
 

In the brief email statement, Citi did not say how the breach had occurred.
 

Another Citi spokesman, James Griffiths in Hong Kong, said the breach had affected 1 percent of North American card customers, which the bank's annual report says total 21 million.
 

But like Japanese electronics and entertainment group Sony, which has declared several security breaches of its networks this year, Citi could come under fire for not telling customers sooner.
 

"It may be the bank's business, but it's the consumer's personal information so consumers deserve to be told about security breaches immediately," said Dan Simpson, a spokesman for Australia's Consumer Action Law Center, an advocacy group.
 

"It's hard to see any reason why this sort of breach couldn't have been disclosed much sooner."
 

GROWING CONCERN
Citigroup joins a growing list of companies that have suffered cyber attacks.
 

Data storage firm EMC Ltd this week offered to replace millions of electronic keys after hackers used data from its RSA security division to break into the network of arms supplier and information technology provider Lockheed Martin.
 

Sony has reported several attacks, including one in which hackers accessed the personal information on 77 million PlayStation Network and Qriocity accounts.
 

Sony was criticized for a delay in telling account holders that their information had been stolen by hackers.
 

Google Inc last week revealed a major attack on its Gmail accounts targeting, among others, senior U.S. government officials that it said appeared to originate in China.
 

Washington has scrambled to assess if security had been compromised by the raid on Google's Gmail system, reflecting increasing concerns among global policymakers about cyber security.
 

Citi said it had discovered the unauthorized access at Citi Account Online, an online banking service, through routine monitoring.
 

"It's definitely a serious security breach when that amount of data's been stolen from a bank," said Sydney-based Ty Miller, chief technology officer of Pure Hacking, a network security company.
 

Citigroup global enterprise payments head Paul Galant, who previously ran the bank's credit card unit, said in April that security breaches are a fact of life for financial institutions.
 

"Security breaches happen, they're going to continue to happen ... the mission of the banking industry is to keep the customer base safe and customers feeling secure about their financial transactions and payments," he told Reuters in an interview.
 

(Additional reporting by Abhishek Takle and Renju Jose in Bangalore and Sonali Paul in Melbourne; Editing by Vinu Pilakkott and Neil Fullick)

Source :
http://www.reuters.com/article/2011/06/09/us-citi-idUSTRE7580TM20110609

Sunday, June 05, 2011

GP Amerika Masuk, F1 2012 Ada 21 Seri

Arya Perdhana - detiksport


Barcelona - FIA mengumumkan kalender sementara F1 musim 2012. Ada satu seri baru masuk, yakni GP Amerika Serikat, sehingga balapan musim depan bakal berlangsung sepanjang 21 seri.

Demikian hasil sidang FIA yang digelar di Barcelona, Jumat (3/6/2011). Inilah highlight dari sidang di Barcelona tersebut selain keputusan menggelar lagi GP Bahrain yang sempat batal.

Seperti dilansir Planet F1, musim depan akan dimulai di Bahrain pada 11 Maret 2012 walau negeri Timur Tengah itu baru menggelar balapan pada 30 Oktober 2011. Musim akan berakhir di Brasil pada 25 November.

Seri baru yang masuk adalah GP Amerika Serikat yang bakal dihelat pada 17 Juni. Hal lainnya, status GP Turki masih dalam konfirmasi menunggu adanya kontrak baru.

Berikut kalender GP F1 2012:
11 Maret Bahrain
18 Maret Australia
01 April Malaysia
08 April China
22 April Korea
06 Mei Turki*
20 Mei Spanyol
27 Mei Monako
10 Juni Kanada
17 Juni Amerika
01 Juli Valencia
15 Juli Inggris
29 Juli Jerman
05 Agustus Hongaria
02 September Belgia
09 September Italia
30 September Singapura
14 Oktober Jepang
28 Oktober India
11 November Abu Dhabi
25 November Brasil

*dalam konfirmasi

Sumber :
http://www.detiksport.com/read/2011/06/04/000901/1652870/80/gp-amerika-masuk-f1-2012-ada-21-seri?query-string

Image : AFP/Dimitar Dilkoff

How Stock Futures Work


In the past couple of years, the U.S. stock market has been volatile. But stock futures are one way to hedge your investments so that no single market fluctuation -- way up or­ way down -- will ruin your portfolio.

The best way to understand how stock futures work is to think about them in terms of something tangible. Let's say you own a popcorn company and you need to buy corn to make your product. Every business day, the price of corn goes up and down. You want to buy corn for the lowest price possible so you can make the most profit when you sell your finished product. But you realize that the price of corn today might be very different than it is a year from now. So you enter into a futures contract with a farmer to buy his corn at a specific price on a certain future date.

The farmer needs to make money, too, so he's not going to agree on a price that's way below the current market value. So you'll agree to a fair price to ensure that both of you will be happy with the transaction in a year. It won't be the highest or the lowest price, but neither one of you will get pounded by drastic market fluctuations.

Stock futures work in much the same way. Two parties enter into a contract to buy or sell a specific amount of stock for a certain price on a set future date. The difference between stock futures and tangible commodities like wheat, corn, and pork bellies -- the underside of the pig that's used to make bacon -- is that stock future contracts are almost never held to expiration date. The contracts are bought and sold on the futures market -- which we'll explore later -- based on their relative values.

In the United States, you can buy and sell single stock futures or stock index futures -- contracts based on the performance of an index like the Dow Jones Industrial Average or the S&P 500.


Source :
http://money.howstuffworks.com/personal-finance/financial-planning/stock-future.htm
 
Image Source/Getty Images

After The Dollar: What Comes Next?

By Peter Schiff


THE DOLLAR'S TERRIBLE FATE
My readers are familiar with my forecast that the US dollar is in terminal decline. America is tragically bankrupt, unable to pay its lenders without printing the dollars to do so, and enmeshed in an economic depression. The clock is ticking until the dollar faces a crisis of confidence like every other bubble before it. The key difference between this collapse and, say, the bursting of the housing bubble is that the US dollar is the backbone of the global economy. Its conflagration will leave a vacuum that needs to be filled.

Mainstream commentators often discuss three main contenders for the role: the euro, the yen, or China's RMB (known colloquially as the "yuan"). These other currencies, however, each suffer from a critical flaw that makes them unready to carry the reserve currency role in time for the dollar's collapse. When it comes to fiat alternatives, it appears the world would be going out of the frying pan and into the fire.

EURO: FRAYING AT THE EDGES
The euro is a ten-year-old experiment in uniting divergent political, economic, and cultural interests under one monolithic fiat currency held in the hands of one very powerful central bank.

If managed correctly, such a currency could serve to keep its member-governments honest - but that is not the world in which we live. Instead, the fiscally irresponsible members are discussing ditching the currency at the first sign of trouble. That is, they'd rather have their own national currencies to inflate in order to cover over their burdensome public debts. So, in order to keep the euro together, creditor states have been strong-armed into bailouts of the debtors - even though such measures violate the compact that created the common currency.

The question becomes: how long do Germans - still wrought with the memory of Weimar hyperinflation and the rise of the Third Reich - want to keep printing euros to pay the debts of the spendthrift Greeks? How many German politicians will ride to electoral victory on promises of unending bailouts and higher prices across Europe? This is the fundamental flaw of the euro.

And, of course, Greece isn't the only problem. Ireland and Portugal are vying for second-worst debt crisis in Europe. Spain, representing over 12% of eurozone GDP, saw sovereign yields jump from 4.1% at the beginning of 2010 to 6.6% by the end of the year. Yields on most other eurozone countries have been rising as well - a clear indication that the eurozone is an increasingly risky bet.

While a euro secession by the PIGS could actually leave a stronger currency region at the end, it would be a traumatic event. That prospect is undermining confidence in the euro at just the time when the world is considering where to go next.

Perhaps a mature currency that didn't falter so easily amidst the recent global financial crisis would be a good contender for the world's reserve. The euro, by contrast, is both young and in serious trouble. If less than two-dozen nations are too immense a burden for the euro to shoulder, should we expect better results when it's stretched across two hundred?

YUAN: CAPITALIST COUNTRY, COMMUNIST CURRENCY
The investment community is slowly coming around to my long-held excitement about the miraculous growth of China. This is no frenzy. In fact, if anything, I think many are still too skittish when it comes to this market. Yet, those that are jumping on the bandwagon are now proclaiming the Chinese yuan as the logical successor to the dying dollar. But while China is becoming an immense economic force, the yuan itself is hobbled by the country's communist past.

Foremost, China enforces stern capital controls on the yuan. A reserve currency must be freely and easily exchangeable with other currencies. Even within China's borders, one cannot exchange large amounts of yuan for dollars or any other currency.

China is slowly undertaking reforms to relieve these controls, but remember they were not put there arbitrarily. The controls allow China to suppress the value of the yuan, thereby maintaining artificially high exports, among other consequences. If China allowed the yuan to trade freely, it would lose the power it maintains over its money - and by extension, its people.

Let's remember that all fiat currencies are routinely manipulated and inflated. The People's Bank of China has reported M2 growth of over 140% in the past five years - almost entirely to maintain a stable exchange rate with a depreciating dollar. Given rampant inflation, combined with exchange restrictions and a serious lack of transparency, the yuan is simply not ready for primetime.

YEN: BLACK HOLE OF DEBT
The Japanese yen is the third amigo at the international fiat fiesta. While it doesn't suffer the structural risks of the euro, the yen is subsisting in an environment of massive sovereign debt. Japan's debt-to-GDP ratio is the highest of any developed country at 225%, meaning there is a perpetual impetus to print more yen to pay it back. The yen must endure this debt-noose, making it a poor alternative to the USD, which suffers the very same problem.

While I believe Japan is in a much better position because it generally maintains a net trade surplus and because most of their debt is held domestically, it's still not a stable unit with which to conduct world trade.

Perhaps more importantly, with a world seeking yen reserves, the price of yen would increase drastically. This is politically unpalatable in Japan, where the export lobby is constantly trying to push the yen down to boost their sales overseas.

These two factors combine in such a way as to make the yen a plainly infeasible reserve currency. The appreciation in yen value would simultaneously make Japan's debt problems worse and cause its export industry to suffer greatly, meaning that Japan probably doesn't want this role any more than we want her to have it.

As an aside, if you type "yen as reserve currency" into Google, it will ask, "Did you mean: yuan as reserve currency?" I guess even the world's smartest search engine doubts the yen could fill that role.

THE SIMPLEST ANSWER IS OFTEN THE BEST
As J.P. Morgan famously said to Congress in 1913, "gold is money and nothing else." Morgan meant that gold was unmatched in its effectiveness as a store of value and medium of exchange.

Given that his namesake bank started accepting physical gold bullion this past February as counterparty collateral, why should the trend of a widespread return to gold be considered only a remote possibility? On the contrary, it should be expected - if for no other reason than every other currency is fundamentally dismal.

Markets are powerful things, and require a reliable medium of exchange. The call for sound money is not just philosophical; it is derived from the market itself. Throughout human history, merchants have always turned to pure gold and silver over every pretender. This is not the first experiment in a paper money system, nor is it the first widespread debasement of money. In fact, the lessons of history were impressed upon our well-read Founding Fathers to the point that they included the following clear language in the Constitution: "No state shall... make any Thing but gold and silver Coin a Tender in Payment of Debts."

While it has always been possible that another fiat currency would rise up to take the dollar's place, and thereby keep this irrational experiment in valueless money going awhile longer, the particular circumstances that abound today make it seem less and less likely to me. Instead, I'm seeing signs that the world is moving back to gold at a breakneck speed.

This is a return to normal and has many positive implications for the global economy. It's certainly a trend we can all welcome, and profit from.


Peter Schiff is CEO of Euro Pacific Precious Metals, a gold and silver dealer selling reputable, well-known coins at competitive prices.


Source :
http://www.gold-eagle.com/editorials.html

Lima Gunung Api Spektakuler yang Wajib Dikunjungi

Gunung Bromo, Indonesia


Untuk aksi vulkanik dan pemandangan yang menakjubkan, Gunung Bromo di Jawa Timur tidak punya lawan sepadan. Gunung setinggi 2329 m di atas permukaan laut ini selalu mengeluarkan asap belerang dan kadang tertutup kabut lebat. Keindahan yang sangat layak untuk diabadikan.

Gunung Bromo adalah gunung “termuda” dari kompleks gunung api Tengger yang luas dan berumur 820 ribu tahun. Dari Gunung Bromo, pengunjung bisa melihat puncak tertinggi di Jawa, yaitu Gunung Semeru, yang aktif mengeluarkan asap dalam jumlah besar tiap 20 menit.

Gunung Bromo memang relatif mudah dicapai (bisa dengan 45 menit berjalan kaki atau menaiki jip dari desa terdekat, Cemoro Lawang). Tapi kondisinya tidak selalu aman. Dua turis meninggal karena terkena ledakan batu pada 2004.

Gunung Hallasan, Korea Selatan


Gunung Hallasan, puncak tertinggi di Korea (1950 mdpl), termasuk dalam kelompok gunung api Jejudo.

Ada sekitar 4 ribu jenis hewan dan 1800 tumbuhan yang menjadikan Hallasan sebagai habitat mereka. Lihat juga danau kawah Baekrokkdam di puncak. Baekrokkdam atau “Danau Seratus Rusa” yang indah mengilhami cerita rakyat tentang peri-peri yang turun dari langit untuk bermain dengan rusa putih. Banyak turis yang mengunjungi Hallasan pada musim semi untuk melihat mekarnya bunga azalea di pegunungan.

Gunung ini juga cukup mudah didaki. Jalur sepanjang 10 km dapat selesai Anda jalani dalam sehari.


Gunung Aso, Jepang


Kaldera terbesar di dunia ini (lebarnya 24 km) memiliki kuil pemujaannya sendiri. Gunung Aso adalah penanda Jepang yang paling terkenal dan penghasil uang untuk prefektur Kumamoto di Kyushu, Jepang.

Atraksi utama di Gunung Aso adalah danau kawah berwarna biru muda yang beruap di Gunung Nakadake. Kereta gantung akan mengangkut turis menuju puncak gunung api, dan di sana ada kompleks yang penuh dengan kios oleh-oleh serta jajanan. Di pinggir kawah juga ada semacam trotoar yang tertata rapi. Di Aso, Anda juga akan menemukan sekumpulan tempat pemandian air panas.


Gunung Pinatubo, Filipina


Gunung Pinatubo tidak sekadar “pulih” dari bencana ledakan besar pada 1991, tapi kini juga menjadi sumber pemasukan untuk lokasi utama olahraga ekstrem.

Pada 1991, Gunung Pinatubo mengeluarkan ledakan vulkanik terbesar kedua dunia dalam 100 tahun terakhir. Ledakan itu menyebabkan suhu dunia turun 17,27 derajat Celsius dan korban tewas mencapai 800 orang. Kerugian financial ditaksir sekitar $ 250 juta.

Dua dekade kemudian, kota-kota di sekitar Gunung Pinatubo hidup dari sektor pariwisata karena ledakan legendaris tersebut.

Anda bisa melakukan pendakian ekstrem di Angeles City serta paket-paket berkendara di antara aliran lahar Pinatubo, yang bentuknya berupa kolam lumpur raksasa berisi materi vulkanis. Ada juga kegiatan terjun payung dan tur udara seharga $ 55 per orang.


Gunung Fuji, Jepang


Tidak mungkin menulis tentang gunung api utama di Asia tanpa memasukkan Gunung Fuji dalam daftar. Gunung Fuji atau Fuji-san adalah gunung tertinggi di Jepang dan ikon nasional atas keindahan pemandangan dan ketinggiannya (3776 m).

Selain menjadi tempat paling utama untuk berfoto dan memamerkannya ke teman-teman atau keluarga di rumah, Gunung Fuji adalah lokasi olahraga ekstrem bagi pencari adrenalin. Setiap musim panas, sekitar 200 ribu orang mendaki gunung ini. Waktu yang mereka butuhkan antara 4-8 jam. Ada juga “sekolah” dan pusat paragliding di area parkir stasiun Gotemba kelima.

Pengunjung bisa saja tidak beruntung datang ke Gunung Fuji saat berawan. Sebagai gantinya, Anda bisa mengunjungi Hakone yang permai di timur Gunung Fuji, serta Lima Danau Fuji, di utara gunung api.


Sumber :

http://id.travel.yahoo.com/jalan-jalan/117-lima-gunung-api-spektakuler-yang-wajib-dikunjungi 

Berlian Mahal, Batu Safir Semakin Bersinar


TREN KONSUMSI BATU MULIA
oleh Christine Novita Nababan
www.kontan.co.id


NEW YORK. Berlian adalah abadi. Tapi, seiring kenaikan harga berlian, para penggemarnya mulai "selingkuh". Para pasangan pengantin kini mulai memilih beragam pilihan batu cantik yang lebih miring harganya. Sebut saja batu safir, rubi, dan zamrud yang tidak kalah indah dibandingkan dengan berlian.

Contohnya Sarah De Remer, seorang teknisi medis dari Broadway, New Jersey, yang melangsungkan pertunangannya bulan lalu dengan cincin safir yang dirancang bersama tunangannya. "Saya suka tampil menonjol. Jadi, kami memilih sesuatu yang berbeda," kata Sarah.


Tren batu berwarna dipelopori kombinasi berlian-rubi milik pelantun lagu I Wanna Love You Forever, Jessica Simpson. Terakhir adalah berlian safir Kate Middleton yang menikah dengan Pangeran William.


Selain harga dan tren, faktor lain yang menyebabkan orang mencari alternatif berlian adalah karena batu mulia itu mendapat julukan buruk: blood diamond. Ia dipakai untuk membiayai perang saudara di Afrika.


Andrew Schloss, Direktur Reinstein Ross di New York mengakui, safir kini kian populer. Pemegang merek perhiasan Tiffany & Co ini telah menjual safir lebih dari 170 tahun. "Sekarang ini memang sangat populer menggunakan batu mulia berwarna," terang Schloss.


Menurut Heather Levine, Senior Editor Fashion TheKnot.com, safir merah jambu adalah warna yang paling populer saat ini. Dulu, Jennifer Lopez, penyanyi dan aktris, menggunakan batu safir berwarna merah jambu saat bertunangan dengan mantan kekasihnya Ben Affleck pada 2002 lalu. "Pilihan ini memberi rasa nyaman kepada pengantin," kata Levine.


Berdasarkan Wedding Report Inc, warga Amerika Serikat menghabiskan US$ 6,12 miliar untuk membeli 4.365 cincin pertunangan dari berlian sepanjang tahun lalu. Belanja itu itu turun 31% ketimbang 2009. "Ketika resesi 2008, banyak pasangan menyadari apa yang mereka sejatinya sanggup mereka beli," terang Shane Mc Murray, pengelola laporan pernikahan Tucson, Arizona.


Maklum, harga satu karat berlian berkualitas bisa mencapai US$ 11.000. Dengan ukuran yang sama, rubi bisa diperoleh seharga US$ 4.000, batu safir biru US$ 1.600-US$ 2.000, dan zamrud di kisaran US$ 8.000.


John Watkins, seorang perajin emas di California menambahkan, rubi dan safir terbuat dari korundum dan mineral yang sama dengan berlian. Skala Mohs, pengukur kekerasan mineral dari 1 sampai 10, menyebutkan, korundum rubi dan safir berada di peringkat 9, sedangkan berlian ada di urutan ke-10.


Sejak De Beers memperkenalkan slogan Diamond are Forever pada tahun 1948, batu-batu berharga menjadi pilihan utama cincin pertunangan para pasangan di dunia.


Sumber :
http://internasional.kontan.co.id/v2/read/1307173123/69321/Berlian-mahal-batu-safir-semakin-bersinar


As World Millionaires Multiply, Singapore Holds Its Lead

by Venessa Wong

provided by
Bloomberg
Businessweek 


Overall, global wealth grew fastest in the Asia Pacific region last year. North America came in second.
 
Singapore seems modest by some measures: Median income among working households was only about S$5,700 (about US$4,500) in 2010, according to the Singapore Department of Statistics. Yet in this small island nation of only 5 million, known for extravagant shopping, high-end restaurants, and draconian chewing-gum laws, nearly one in every six households has more than $1 million in assets, making it the densest population of wealthy households in the world, according to a new report by Boston Consulting Group.

As the financial markets improved last year, global wealth grew in nearly every region in the world. The fastest, at 17.1 percent, came in the Asia Pacific region (excluding Japan), followed by North America at 10.2 percent. "Global wealth is at an all-time high," says BCG Senior Partner Monish Kumar.

According to BCG's study, global assets under management grew 8 percent, to $121.8 trillion, about $20 trillion above the level during the depths of the global financial crisis. The number of millionaire households grew 12.2 percent, to 12.5 million, and although they represented only 0.9 percent of all households, they held 39 percent of global wealth.

Only Liquid AssetsBCG looked at 62 markets covering more than 98 percent of global GDP and measured assets that included cash deposits, money market funds, listed securities held directly or indirectly through managed investments, and onshore and offshore assets — but not wealth attributed to investors' own businesses, residences, or luxury goods.

Wealth in North America, the world's richest region, had the largest dollar-value gain: $3.6 trillion. The U.S. remains home to the most millionaire households — 5,220,000 (up 10.7 percent from 4,715,0000 households in 2009) — although the share was only 4.5 percent of all households, BCG data show.
While China and India are driving wealth creation in Asia, Singapore also grew at a fast pace. The number of millionaire households in Singapore jumped about 38.6 percent in 2010, to 170,000, from nearly 123,000 in 2009, according to BCG data. The country has had the largest proportion of millionaire households for several years, and the share continues to grow: Singapore's millionaire households increased to 15.5 percent of total households in 2010 from 11.4 percent in 2009.

The rise is due to Singapore's expanding economy, which has grown mainly on such exports as consumer electronics and pharmaceuticals, as well as financial services. Real GDP growth averaged 7.1 percent per year from 2004 to 2007, according to the CIA World Factbook and reached nearly 14.7 percent in 2010—faster than China's 10.3 percent growth rate.

Not Just Tycoons
Among Singapore's well-known billionaires are Wee Cho Yaw, chairman of United Overseas Bank Group (Singapore: UOB - News), as well as the families of the late real estate mogul Ng Teng Fong and financier and hotelier Kho Teck Phuat. Still, many of the country's wealthy are not tycoons but entrepreneurs and affluent immigrants, says Tjun Tang, partner and managing director of BCG in Hong Kong. Other billionaires include philanthropist Richard Chandler in New Zealand and real estate developer Zhong Sheng Jian in China.
City-states such as Singapore, along with other small countries and administrative regions with a high density of millionaire households, such as Switzerland, Qatar, and Hong Kong, tend to be hubs of commerce and finance and have greater economic generation within a smaller population, says Tang.

Another factor driving wealth: Singapore's investor scheme, which grants permanent residence to certain investors, says Tang. According to the website of Janus Corporate Solutions, people can "invest [their] way to Singapore permanent residence" by investing more than a certain minimum in a new business startup or Global Investor Program-approved fund or in expanding an existing business in Singapore.

More Money, But Higher Costs
With this wealthy population comes a relatively high cost of living. In a 2010 cost-of-living survey of 214 cities by consulting firm Mercer, Singapore is the 11th most expensive city in the world for expatriates, on a par with Oslo and more expensive than New York City.
Mercer also gave Singapore high scores in its 2010 quality-of-life study of 221 cities: It was the top-scoring Asian city, followed by Tokyo.

The economic trends remain a concern around the world, yet BCG expects that with strong capital markets, GDP growth, and increased savings, global wealth will grow at a compound annual growth rate of 5.9 percent through 2015. Singapore has already led with the highest proportion of millionaire households for several years. With the Asia-Pacific region's share of global wealth expected to increase to 23 percent in 2015, from 18 percent in 2010, Tang says, "the trends seem to be in Singapore's favor."
Here are the countries with the highest proportion of millionaires:

No. 1: Singapore
Millionaire households as a share of country's total households: 15.5%
Number of millionaire households: 170,000
2009 ranking: 1

Singapore is home to the world's greatest concentration of millionaire households. Deloitte expects that by 2015, it may surpass Switzerland in per capita wealth among millionaire households. Singapore is Asia's eighth-most-expensive location, according to ECA International.

No. 2: Switzerland
Millionaire households as a share of country's total households: 9.9%
Number of millionaire households: 330,000
2009 ranking: 3

With nearly one in 10 households in Switzerland a millionaire household, the country is one of the world's most expensive. Residents of Geneva and Zurich pay about 20 percent more on average for products, services, and accommodation than do people in other Western European cities, according to a UBS study. Food prices in particular are high — about 45 percent above levels in the rest of Western Europe.

No. 3: Qatar
Millionaire households as a share of country's total households: 8.9%
Number of millionaire households: 30,000
2009 ranking: 2

Qatar is the world's fastest-growing economy, as well as one of the richest: Annual GDP growth is estimated at 19.4 percent in 2010, with per capita GDP at $145,300, according to the CIA's World Factbook. The country has the world's third-largest reserves of natural gas, with oil and gas accounting for more than half of GDP, 85 percent of export earnings, and 70 percent of government revenues.

No. 4: Hong Kong
Millionaire households as a share of country's total households: 8.6%
Number of millionaire households: 200,000
2009 ranking: 4

In the past decade, Hong Kong's manufacturing industry moved to mainland China and its service industry grew to more than 90 percent of GDP. While Hong Kong's GDP fell in 2009 as a result of the global financial crisis, recovery began in the third quarter of 2009 and in 2010 the economy grew by nearly 6.8 percent, according to the CIA's World Factbook. The housing market also continues to grow tremendously: In 2010 Q4, home prices were up 20.1 percent year-on-year, according to Knight Frank.

No. 5: Kuwait
Millionaire households as a share of country's total households: 8.5%
Number of millionaire households: 40,000
2009 ranking: 5

Petroleum accounts for nearly half Kuwait's GDP, 95 percent of export revenues, and 95 percent of government income, according to the CIA's World Factbook. The rise in global oil prices has boosted government budget revenue and revived government consumption and economic growth.

No. 6: United Arab Emirates
Millionaire households as a share of country's total households: 5%
Number of millionaire households: 50,000
2009 ranking: 6

Since oil was discovered in the U.A.E. more than 30 years ago, the country has transformed itself from an impoverished region to a modern state with a high standard of living, high per capita income, and a sizable annual trade surplus, according to the CIA's World Factbook. Oil and gas output represents about 25 percent of GDP.

No. 7: United States
Millionaire households as a share of country's total households: 4.5%
Number of millionaire households: 5,220,000
2009 ranking: 7

After declining in 2008, the U.S. millionaire population grew in 2009 and continued to rebound in 2010, according to BCG. While the economy has shown only slight improvement, the U.S. still has by far the most millionaire households of any country, as well as the largest number of ultra-high-net-worth households (those with more than $100 million in assets under management).

No. 8: Taiwan
Millionaire households as a share of country's total households: 3.6%
Number of millionaire households: 280,000
2009 ranking: 8

Taiwan has a widening wealth gap: In 2009, the top quintile of income earners made 6.34 times as much as the bottom quintile, up from 5.5 times 10 years ago, according to the Directorate General of Budget, Accounting, and Statistics. The government recently considered passing a luxury tax on: non-owner occupied homes sold within two years of purchase; automobiles, yachts, helicopters, and airplanes that cost more than TWD3 million (about $104,700); and ivory, coral, furs, and furniture worth more than TWD500,000 (about $17,400), reported the Christian Science Monitor.

No. 9: Israel
Millionaire households as a share of country's total households: 3.4%
Number of millionaire households: 80,000
2009 ranking: 10

The share of millionaire households remains high in Israel, which has shown signs of economic recovery. Following growth of 4 percent in 2008, Israel's GDP slipped by 0.2 percent in 2009, then rose by 3.4 percent in 2010 as exports rebounded, according to the CIA's World Factbook. Home prices in Israel were up year-on-year during each quarter in 2010, show data from Knight Frank.

No. 10: Belgium
Millionaire households as a share of country's total households: 3.1%
Number of millionaire households: 140,000
2009 ranking: 9

Belgium has the greatest concentration of millionaires among EU member countries. Residents do not pay a wealth tax, but are subject to personal income tax, as well as withholding tax, social security, inheritance and gift tax, and communal taxes, according to Deloitte Touche Tohmatsu.

Wong is a lifestyle and real estate reporter for Bloomberg Businessweek.
Click here to see the full list of Countries With the Highest Proportion of Millionaires.

Source: http://finance.yahoo.com/real-estate/article/112859/millionaires-world-singapore-businessweek

Share

Twitter Delicious Facebook Digg Stumbleupon Favorites